
How Are Cell-Cell Interactions Measured?
August 12, 2026
Two cells can be close enough to interact without meaningfully influencing one another.
A ligand and receptor can both be expressed without producing a response (Dimitrov et al., 2022). A cell can carry the molecular signature of activation even after the partner that caused it has disappeared (Di Carlo et al., 2026). And a population-level assay can show that something happened without revealing which cellular encounter caused it (Baghdasarian et al., 2026).
This is what makes cell-cell interactions difficult to measure: each method captures a different layer of evidence.
Cell-cell interactions can be studied using single-cell RNA sequencing, ligand-receptor inference, spatial biology, microscopy, co-culture assays, and functional cell-cell interaction assays. Together, these methods reveal molecular state, possible communication, spatial context, observed behavior, population-level responses, and the functional outcomes of defined cellular encounters. The right approach depends on which of these questions the study needs to answer.
Comparing Approaches for Studying Cell-Cell Interactions
Cell-cell interactions can be studied through molecular state, computational inference, spatial context, observed behavior, population-level response, or interaction-resolved function. Each layer answers a different biological question (Di Carlo et al., 2026).
| Approach | Typical readouts | Best suited for | Important limitation |
|---|---|---|---|
.png) Single-cell RNA-seq
Single-cell RNA-seq
|
Gene expression profiles, cell types, states, and transcriptional programs | Profiling identity, activation, differentiation, and response | Partner identity and interaction history may be lost |
 Ligand-receptor inference
|
Predicted ligand-receptor pairs, interaction scores, and signaling networks | Prioritizing candidate communication pathways | Does not directly measure engagement, signaling, or functional response |
 Spatial biology
|
Spatial gene or protein expression, cell locations, and cellular neighborhoods | Connecting molecular features to tissue organization | Proximity does not prove a functional interaction |
 Microscopy and live-cell imaging
|
Cell contact, morphology, movement, marker intensity, and dynamic events | Visualizing cellular encounters over time | Throughput, molecular depth, or cell recovery may be limited |
 Co-culture assays
|
Cytokine secretion, activation, proliferation, viability, and population-level killing | Testing functional effects between cell populations | Pair identity, timing, and heterogeneity may be unclear |
.png)
Functional cell-cell interaction assays
Interaction-resolved |
Partner identity, interaction timing, functional response, and downstream molecular readouts | Connecting defined cell interactions to measured functional outcomes | Requires controlled pairing, appropriate readouts, and experimental controls |
Single-Cell RNA-seq: What State Is Each Cell In?
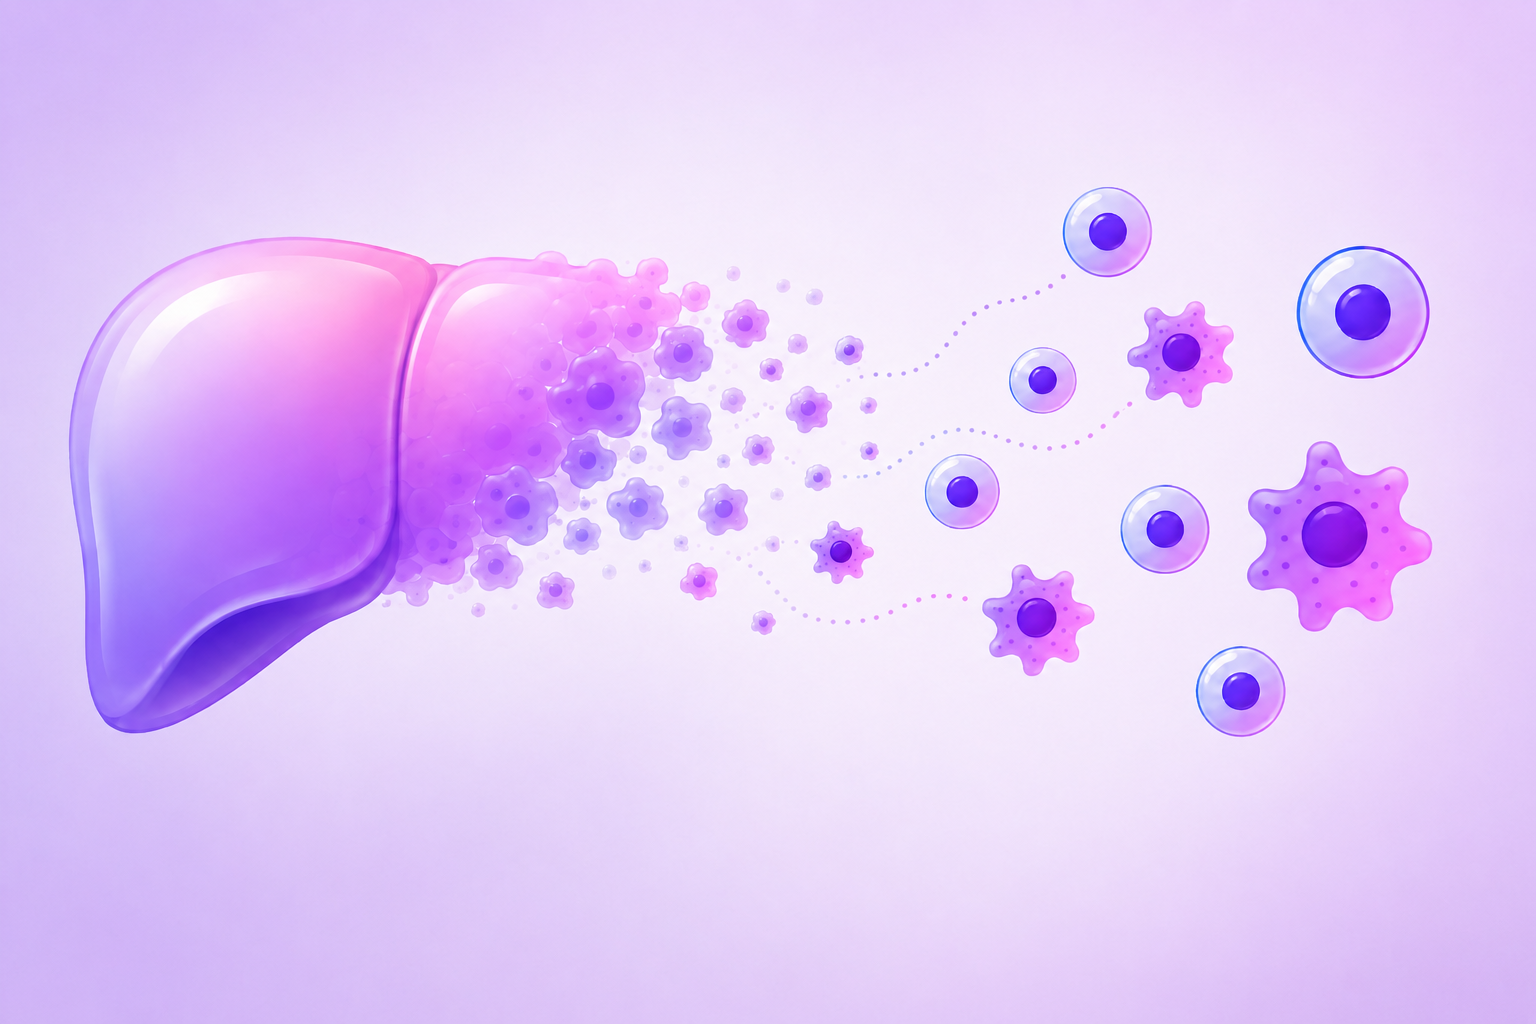
Single-cell RNA sequencing begins by separating a sample into individual cells (Macosko et al., 2015; Zheng et al., 2017). RNA from each cell is captured, barcoded, and sequenced to generate an expression profile for each cell.
Its strength is resolving the cellular diversity within a sample. Researchers can use single-cell RNA-seq to identify cell types and states, detect rare populations, and compare molecular responses across conditions (Tirosh et al., 2016; Zheng et al., 2017). In cell-cell interaction studies, it can reveal activation, exhaustion, inflammatory programs, and other states that may have resulted from an interaction.
The tradeoff is that the resulting profiles are no longer directly linked to the cellular partners and local signals that shaped them (Di Carlo et al., 2026). An activated T cell, for example, could have responded to direct tumor recognition, an antigen-presenting cell, a cytokine gradient, or broader inflammation. Single-cell RNA-seq can describe the resulting state with considerable depth, but it does not always reveal which partner caused it.
Single-cell RNA-seq profiles can also serve as inputs for computational tools that infer possible communication between cell populations. These relationships remain predictions rather than direct measurements (Browaeys et al., 2020; Efremova et al., 2020).
“We often profile the responding cell after the encounter has ended. The state remains, but the interaction that created it may be gone.”
Ligand-Receptor Inference: What Communication Might Be Possible?
The logic behind ligand-receptor inference predates single-cell sequencing. Earlier approaches combined curated ligand-receptor relationships with population-level expression profiles from purified cell types. Single-cell RNA-seq extended this strategy to cell types and states within heterogeneous samples (Ramilowski et al., 2015; Efremova et al., 2020).
Modern tools identify potential sender cells expressing a ligand and receiver cells expressing the corresponding receptor, then score or rank the candidate interactions. These predictions can be used to prioritize signaling pathways for further study (Efremova et al., 2020; Jin et al., 2021).
Expression of complementary molecules does not prove that signaling occurred. TGF-β can be secreted in a latent form that requires extracellular activation, while Notch signaling requires direct cell contact and mechanical force generated through ligand endocytosis (Fontana et al., 2005; Meloty-Kapella et al., 2012). Inferred networks can also vary depending on the ligand-receptor database and scoring method used (Dimitrov et al., 2022).
Spatial Biology: Which Cells Are Positioned to Interact?
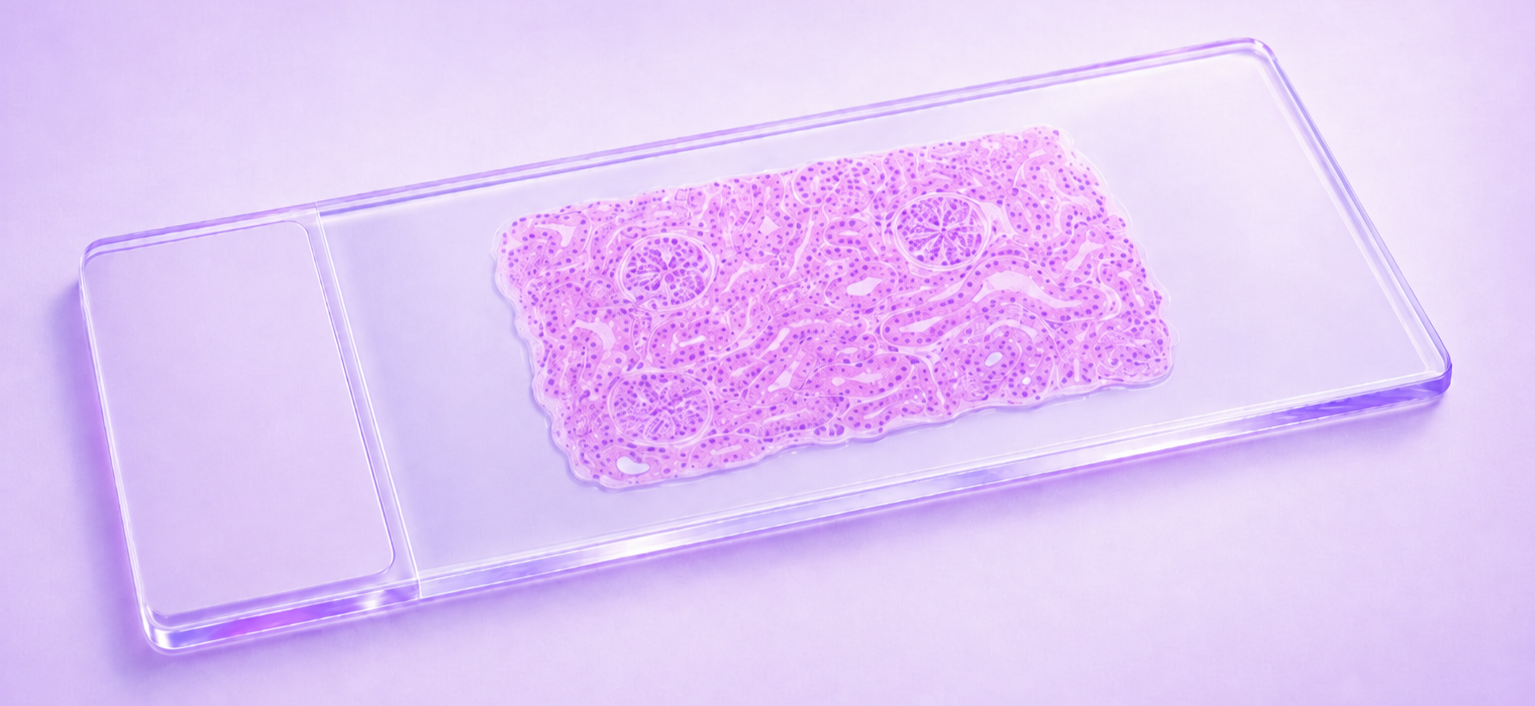
Most spatial transcriptomics and spatial proteomics workflows begin by cutting a thin section from a larger tissue and mounting it on a slide (Ståhl et al., 2016; Sui et al., 2025). RNA, proteins, or other molecular features are then measured while preserving their positions within that section. Depending on the approach, signals may be assigned to individual cells, small tissue regions, or defined coordinates.
Spatial biology is particularly valuable for understanding tissue architecture, cellular neighborhoods, immune infiltration or exclusion, and how molecular features vary across different regions of a tissue (Keren et al., 2018). In a tumor, for example, it can reveal whether cytotoxic T cells infiltrate tumor regions, remain confined to the surrounding stroma, or cluster near antigen-presenting cells.
However, standard spatial profiling methods carry distinct dimensional and temporal constraints. Although three-dimensional thick-tissue approaches are emerging (Sui et al., 2025), most datasets rely on thin physical tissue sectioning. Because measurements are taken from a single 2D plane, cells that appear isolated within the section plane may actually connect to partners directly above or below it. Furthermore, spatial profiling captures only a single, static snapshot in time. A transient signaling event, hit-and-run engagement, or cellular contact that occurred prior to tissue fixation will no longer be visible, making it difficult to trace the dynamic history of an interaction over time.
Spatial proximity also does not establish that communication occurred (Di Carlo et al., 2026). Neighboring cells may not engage, and a cell may respond to a soluble signal from a more distant source. Spatial biology provides valuable tissue context, but functional follow-up is necessary to determine what cells actually do to one another.
Microscopy and Live-Cell Imaging: Can We Observe Cells Interacting?
Imaging approaches range from fixed-tissue methods such as immunohistochemistry and immunofluorescence to live-cell and intravital microscopy (Keren et al., 2018; Scheele et al., 2022). Fixed imaging uses labeled antibodies or other probes to visualize cells and selected molecular features at a specific time point. Live-cell imaging repeatedly records the same field to follow cells over time, while intravital imaging extends this approach to cells within living tissues.
Fixed imaging is useful for examining cell morphology, marker expression, and spatial relationships within a sample. Live imaging adds the ability to observe migration, contact duration, immune synapse formation, calcium signaling, changes in morphology, and target-cell killing (Celli et al., 2007; Scheele et al., 2022). This makes imaging particularly valuable when the appearance, timing, or physical behavior of an interaction is central to the question.
The selected markers and recorded field determine which events imaging can capture (Scheele et al., 2022). Throughput and molecular depth may be lower than sequencing or flow-based approaches, and recovering a particular interacting pair for downstream analysis can be difficult. A visualized contact also does not always reveal the molecular signals responsible for the observed response (Di Carlo et al., 2026).
Co-Culture Assays: What Happens When Cell Populations Are Combined?
Co-culture assays place two or more cell populations in a shared culture system. Cells may be mixed to allow direct contact or separated by a permeable membrane to study signaling through soluble factors.
These assays are useful for testing whether one cell population affects another and for comparing responses across experimental conditions. The readouts can vary widely. Well-level assays may measure bulk cytokines, molecules released from damaged cells, or changes in electrical impedance as target cells die (Cerignoli et al., 2018; Martinez et al., 2018). Other workflows use flow cytometry (Martinez et al., 2018) or single-cell RNA sequencing after co-culture (Baghdasarian et al., 2026) to examine changes within individual cells or populations.
Even when the downstream measurement has single-cell resolution, the interaction history may still be lost. Some cells may never encounter a partner, while others may contact several or interact for different lengths of time. The resulting measurements can reveal how individual cells changed, but not necessarily which partner or encounter produced that response (Baghdasarian et al., 2026).
Functional Cell-Cell Interaction Assays: What Happens Between Defined Partners?
Functional cell-cell interaction assays bring defined cell partners together and connect partner identity and interaction context to measured functional or molecular outcomes. These assays may use microwells, microfluidic compartments, droplets, or other controlled microenvironments to establish cell contact, preserve partner context, and connect an observed response to a specific cellular encounter (Ronteix et al., 2022; Baghdasarian et al., 2026).
This approach is particularly useful when the biological question depends on what happens after defined cells meet. Examples include whether a T cell activates after contacting a tumor cell, whether an NK cell responds to a target, or whether a bispecific antibody promotes productive immune-target engagement (Baghdasarian et al., 2026; Di Carlo et al., 2026; Liang et al., 2026). Interaction-driven readouts may include activation, suppression, secretion, binding, killing, or changes in gene expression.
Nanovials create suspendable, defined microenvironments in which selected cell partners can be co-localized and retained for functional analysis (Baghdasarian et al., 2026). Their preformed nanoliter-scale cavities keep cell pairs, assay reagents, and interaction-driven signals in close proximity. Defined pairs can then be analyzed and sorted using standard flow cytometry workflows, recovered for further characterization, or connected to downstream sequencing.
The Cell-Cell-seq workflow uses this format to establish defined cell pairs, measure responses after contact, enrich pairs of interest, and profile their molecular states using downstream single-cell RNA sequencing. Unlike bulk co-cultures, where cells may encounter different partners at different times, Cell-Cell-seq preserves the context of a defined cellular encounter (Baghdasarian et al., 2026). Researchers can ask not only, “What state is this cell in?” but also, “What happened when this cell met that cell?”
In a tumor–T cell model, Cell-Cell-seq revealed coordinated transcriptional programs that were not simply the sum of the two cells profiled in isolation (Baghdasarian et al., 2026). A related workflow resolved contact-associated NK cell activation in defined tumor cell pairs (Liang et al., 2026).
These assays still require deliberate experimental design. Pairing strategy, timing, controls, and readout selection all influence what can be concluded (Baghdasarian et al., 2026). Because they create controlled ex vivo interactions, they complement rather than replace methods that preserve native tissue architecture (Di Carlo et al., 2026).
From Possible Communication to Measured Function
There is no single best method for studying cell-cell interactions. The right approach depends on the biological question and the type of evidence needed to answer it (Di Carlo et al., 2026).
When the question is what happened between defined cell partners, functional cell-cell interaction assays add a different layer of evidence. They connect partner identity and interaction context to a measured functional outcome rather than relying on proximity, expression, or a population average alone (Baghdasarian et al., 2026).
Nanovials are designed for this measurement gap. By retaining defined cell partners within suspendable, flow-compatible microenvironments, Nanovials preserve cell-cell context and keep interaction-driven signals associated with the cells that produced them. Defined pairs can be measured, sorted, recovered, and connected to downstream molecular profiles (Baghdasarian et al., 2026; Liang et al., 2026).
The goal is not to replace other methods, but to use the approach that matches the biological question and combine methods when multiple layers of evidence are needed (Di Carlo et al., 2026).
Explore Nanovial-enabled functional cell-cell interaction assays.
References
Baghdasarian, S., Wang, Q., Langerman, J., et al. Systematic mapping of emergent transcriptional states in interacting single-cell dyads by Cell-Cell-seq. bioRxiv, 2026. https://doi.org/10.64898/2026.02.05.704136
Browaeys, R., Saelens, W., & Saeys, Y. NicheNet: modeling intercellular communication by linking ligands to target genes. Nature Methods, 17, 159–162, 2020. https://doi.org/10.1038/s41592-019-0667-5
Celli, S., Lemaitre, F., & Bousso, P. Real-time manipulation of T cell–dendritic cell interactions in vivo reveals the importance of prolonged contacts for CD4+ T cell activation. Immunity, 27, 625–634, 2007. https://doi.org/10.1016/j.immuni.2007.08.018
Cerignoli, F., Abassi, Y. A., Lamarche, B. J., et al. In vitro immunotherapy potency assays using real-time cell analysis. PLOS ONE, 13, e0193498, 2018. https://doi.org/10.1371/journal.pone.0193498
Di Carlo, D., Morsut, L., McCain, M. L., et al. Mapping and engineering the human cell–cell interactome. Nature Biotechnology, 2026. https://doi.org/10.1038/s41587-026-03177-2
Dimitrov, D., Türei, D., Garrido-Rodriguez, M., et al. Comparison of methods and resources for cell-cell communication inference from single-cell RNA-seq data. Nature Communications, 13, 3224, 2022. https://doi.org/10.1038/s41467-022-30755-0
Efremova, M., Vento-Tormo, M., Teichmann, S. A., & Vento-Tormo, R. CellPhoneDB: inferring cell-cell communication from combined expression of multi-subunit ligand-receptor complexes. Nature Protocols, 15, 1484–1506, 2020. https://doi.org/10.1038/s41596-020-0292-x
Fontana, L., Chen, Y., Prijatelj, P., et al. Fibronectin is required for integrin αvβ6-mediated activation of latent TGF-β complexes containing LTBP-1. FASEB Journal, 19, 1798–1808, 2005. https://doi.org/10.1096/fj.05-4134com
Jin, S., Guerrero-Juarez, C. F., Zhang, L., et al. Inference and analysis of cell-cell communication using CellChat. Nature Communications, 12, 1088, 2021. https://doi.org/10.1038/s41467-021-21246-9
Keren, L., Bosse, M., Marquez, D., et al. A structured tumor-immune microenvironment in triple-negative breast cancer revealed by multiplexed ion beam imaging. Cell, 174, 1373–1387.e19, 2018. https://doi.org/10.1016/j.cell.2018.08.039
Liang, J., Shao, D., Di Carlo, D., & de Rutte, J. M. Cell-Cell-Seq resolves contact-associated NK cell activation in defined tumor cell dyads. bioRxiv, 2026. https://doi.org/10.64898/2026.06.04.730259
Macosko, E. Z., Basu, A., Satija, R., et al. Highly parallel genome-wide expression profiling of individual cells using nanoliter droplets. Cell, 161, 1202–1214, 2015. https://doi.org/10.1016/j.cell.2015.05.002
Martinez, E. M., Klebanoff, S. D., Secrest, S., et al. High-throughput flow cytometric method for simultaneous measurement of CAR-T characterization and cytotoxicity against solid tumor cell lines. SLAS Discovery, 23, 603–612, 2018. https://doi.org/10.1177/2472555218768745
Meloty-Kapella, L., Shergill, B., Kuon, J., Botvinick, E., & Weinmaster, G. Notch ligand endocytosis generates mechanical pulling force dependent on dynamin, epsins, and actin. Developmental Cell, 22, 1299–1312, 2012. https://doi.org/10.1016/j.devcel.2012.04.005
Ramilowski, J. A., Goldberg, T., Harshbarger, J., et al. A draft network of ligand–receptor-mediated multicellular signalling in human. Nature Communications, 6, 7866, 2015. https://doi.org/10.1038/ncomms8866
Ronteix, G., Jain, S., Angely, C., et al. High resolution microfluidic assay and probabilistic modeling reveal cooperation between T cells in tumor killing. Nature Communications, 13, 3111, 2022. https://doi.org/10.1038/s41467-022-30575-2
Scheele, C. L. G. J., Herrmann, D., Yamashita, E., et al. Multiphoton intravital microscopy of rodents. Nature Reviews Methods Primers, 2, 89, 2022. https://doi.org/10.1038/s43586-022-00168-1
Ståhl, P. L., Salmén, F., Vickovic, S., et al. Visualization and analysis of gene expression in tissue sections by spatial transcriptomics. Science, 353, 78–82, 2016. https://doi.org/10.1126/science.aaf2403
Sui, X., Lo, J. A., Luo, S., et al. Scalable spatial single-cell transcriptomics and translatomics in 3D thick tissue blocks. Nature Methods, 22, 2574–2584, 2025. https://doi.org/10.1038/s41592-025-02574-x
Tirosh, I., Izar, B., Prakadan, S. M., et al. Dissecting the multicellular ecosystem of metastatic melanoma by single-cell RNA-seq. Science, 352, 189–196, 2016. https://doi.org/10.1126/science.aad0501
Zheng, G. X. Y., Terry, J. M., Belgrader, P., et al. Massively parallel digital transcriptional profiling of single cells. Nature Communications, 8, 14049, 2017. https://doi.org/10.1038/ncomms14049